AnyChart JS Charts and Dashboards
Dieses Programm wird Ihnen präsentiert von:
P.O. Box 34069 #381
98124-1069 Seattle
United States
| submit [at] anychart [dot] com | |
| Telefon | +1 (206) 984-1843 |
| Telefax | +1 (206) 984-1843 |
| Website | www.anychart.com |
| Kategorie: | Web Entwicklung / Java & JavaScript |
| Version: | 8.7.0 |
| Release-Datum: | 07.08.2019 |
| Größe: | 17,81 |
| Betriebssystem: | Win XP / Vista / 7 / 8 / 10 |
| Anforderungen: | None. JavaScript/HTML5 based; compatible with all platforms and browsers. |
| Sprachen: | Deutsch, Englisch |
| Downloads: | 0 im März / 21 insgesamt |
Bewertung: 1,67/10 (3 Stimmen abgegeben)
| Download: | cdn.anychart.com/releases/8.7.0/anychart-installation-package-8.7.0.zip |
| Infoseite: | www.anychart.com/products/anychart/overview |
AnyChart is a robust and superfast JavaScript charting library to add great-looking, interactive HTML5 charts into any project, in any browser, and on any platform/OS including mobile ones.
AnyChart provides advanced customization and flexibility opportunities, no matter if you are developing a website, a business intelligence application (BI) for corporate usage, or some software for your clients. Our JavaScript API makes it possible for you to create even big data based charts in real time, with continuous updates and multi-level drill-downs. Moreover, whatever server platform or database you use in your project, AnyChart is ready to fulfill your dream to surprise your customers with amazing informative JS charts and dashboards regardless of device - on Macs, laptops, PCs, smartphones, and tablets.
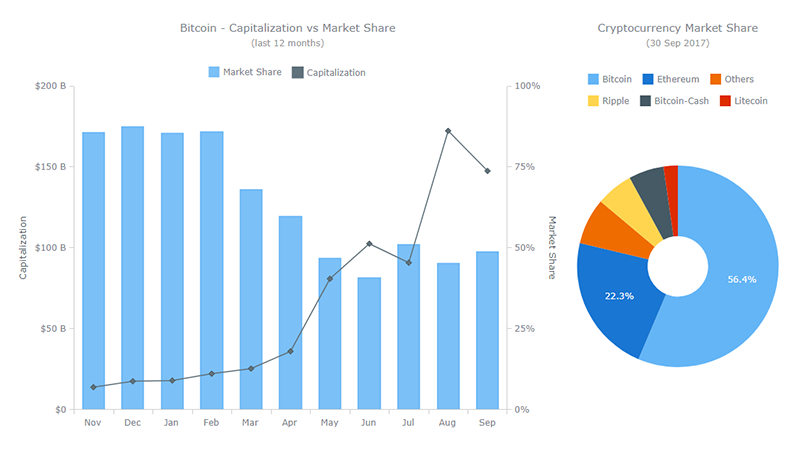
AnyChart provides scatter, line, bar, area, waterfall, spline, funnel, bubble, polar, column, column range, pie, box plot, linear and angular gauges, area spline range, Mekko, Venn, Sankey Diagram, waterfall, quadrant, tag cloud, and lots of other sorts of charts available separately and in combination, 2D and 3D.
In a nutshell, AnyChart HTML5 chart library's advantages boil down to the following out-of-the-box features:
* 60+ chart types;
* chart design themes and color palettes;
* chart export to PDF, PNG, JPG, SVG, PS, chart data export to CSV and XLSX (Excel), social network sharing;
* many web app samples with interactive BI dashboards;
* localization engine (194 predefined locale files),
as well as advanced interactivity (tooltips on hover, drill-down, exclude data point, multi-selection, and more), multiple axes, async rendering, online chart editor, and much more to easily create beautiful interactive JS data visualization for any web projects.
Einblenden / Ausblenden
Hier können Sie die Update-Infos für dieses Programm abonnieren. Sie erhalten dann zukünftig eine Benachrichtigung per Email, sobald ein Update zu diesem Programm eingetragen wurde.
Um die Update-Infos zu abonnieren, tragen Sie nachfolgend Ihre E-Mail-Adresse ein. Sie erhalten dann eine E-Mail mit einem Link, über den Sie das Abo bestätigen müssen.
Sie können die Update-Infos jederzeit wieder abbestellen. Hierzu finden Sie am Ende jeder E-Mail mit Update-Infos einen entsprechenden Link.
Dieser Service ist für Sie vollkommen kostenlos.
Kommentare zu AnyChart JS Charts and Dashboards
Einblenden / Ausblenden
Bisher gibt es keine Kommentare zu diesem Programm.
Selbst einen Kommentar schreiben